
The following documents support analysis necessary for strategy definition for the years 2014 and 2015.
Here you will find the all the information regarding what needs to be analyzed, what kind of frameworks should be used for these analysis and the results from it.
You can deepen your knowledge and get more information about the references in this document by taking a look at Cadle, James, Paul, Debra and Turner, Paul (2010). Business Analysis Techniques: 72 Essential Tools for Success. BCS, UK. (Download here)
What?
PESTL analysis provides a framework for investigating and analyzing the
external environment for an organization. The framework identifies five key areas that should be considered when attempting to identify the sources of change: Political, Economical, Social-cultural, Technological and Legal.
How?
The PESTL analysis technique is usually used in a meeting or workshop


What?
This technique examines the business domain within which an organization operates, and identifies the business pressure that may be brought to bear upon the organization.
How?
The first important thing to clarify is in what market AIESEC in Portugal operates. This is something that we have been discussing and has never been clear. For the purpose of business strategy definition we will define our market
as the Youth Exchange Experience one.
Having this clarified, what we will do is study the 5 different forces bellow and understand what kind of pressure they apply in our market.
You should use the framework in the analysis tool for this, supporting yourself on the criteria there.
Expected outputs?
Which and how this 5 forces impact negatively or
positively in our organization.
What?
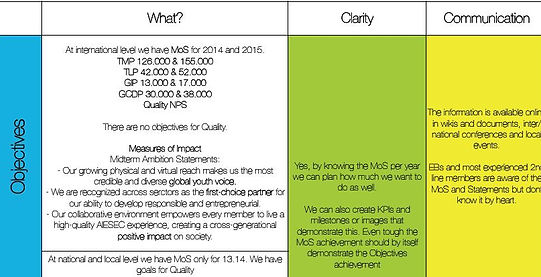
MOST (Mission, Objectives, Strategy and Tactics) analysis is used to analyze what an organization has set out to achieve (mission and objectives) and how it aims to achieve this (strategy and tactics). It is used during the strategic analysis, since it can demonstrate strength within the organization orexpose inherent weaknesses.
Mission: the rationale and direction for the organization.
Objectives: the goals that the organization aims to achieve
Strategy: the medium to long-term plans and actions that will enable theorganization to achieve its objectives.
Tactics: the detailed, short-term plans and actions that will deliver the strategy.
The analysis
PESTL
External Analysis
Internal Analysis
where several ideas and opinions can be sought with experts from each specific area, but should also be complemented with research from reports and official documents.For each area you should consider all the potential changes that mightaffect the organization. After all elements have been listed you should evaluated and rank them according their influence in the organization. It is important to understand that the factors of influence we are looking for fit in the two criteria: they are outside the sphere of control of AIESEC as an organization and that they will have some level of impact upon it.
Expected Output?
For each area you should have a list of no more than 5 external influences in the organization, ranked by importance.
Areas - Political
In this area you should consider topic such as, but not limited to: potential changes of policies and priorities at government level; introduction of new government initiatives; and changes or development in bodies like the European Union and their associate organizations.
Areas - Economical
In this area you should consider topic such as, but not limited to: global trade tendencies; economical situation of the nation and economical area where it is inserted; and national trade tendencies.
Areas - Socio-cultural
In this area you should consider tendencies and changes in our society is form and behaves. For example, influences might come from demographic changes or consumer behavior patterns.
Areas - Technological
In this area you should consider developments in Information Technology or technology specifically applied to our business area.
Areas - Legal
In this area you should consider developments in legal issues, either national, european union or internaional that will affect our orgnization.
Areas - Competitors
Who and how many are our competitors? What is their share of the market? What is our position among our competitiors?
Areas - New Entrants
What are the barriers and/or incentives for getting into our market? What is the likelihood of new entrants coming into our market?
Areas - Substitutes
What and how many substitutes are there available? What is our position compared to these substitutes?
Areas - Buyers
How much choice do buyers have? Can they switch easily? Do they have power in the relationship with the supplier organizations?
Areas - Suppliers
Who and how many are our suppliers? Do suppliers have the power in the relationship with the organizations?
5 Forces of Porter
Resources
MOST
Boston Box
Results Evolution
Analysis
How?
You should analysis this considering the following areas:
Definition: Is there a defined MOST for the organization? Is it complete and consistent, or are there elements missing or out of alignment with each other?
Clarity: Does the MOST set out a clear direction and plan that will enable the organization’s development and provide a focus for the work carried out?
Communication: Are our members aware of the MOST, and is it available as a context for the work they do?
Organizational commitment: Do our members work to deliver the MOST? Do they agree with the content of the MOST and are they supportive of its intent?
Reputation - The marketplace perception of the organization and the goodwill or antipathy generated by this reputation.
Know-how - The information held within the organization and the way it is used to support the organization’s work.
What?
The Resource Audit is used to analyze key areas of internal capability inorder to identify the resource
that will enable the organization change and thosethat will undermine or prevent such efforts.
How?
You should list the amount and characteristics of each resource specifiedbellow.
Expected Output?
Clear overview of our organizational resources.
Physical - Equipments and spaces owned and used by AIESEC.
Human - Number and characteristics of our human resources.
Financial - Financial Resources available – organization’s financial assets and possibility of loans and credit.

What?
The Boston Box works to aid portfolio management. The box is a 2x2 matrix with four quadrants. The axes represent low to high market growth and low to high market share. The quadrants represent the following areas:
Dogs
These are business units or products that have low relative share and are in unattractive, low-growth markets.
Cash Cows
These are low-growth business units of products that have a relatively high market share. These are mature, successful products that can be sustained without large investment.

Stars
These are high-growth business units or products with a high percentage of market share.
Problem Child
These are the business units or products that low market share, but operating in high-growth markets.
How?
Calculate relative market share. Relative market share can be calculated in terms of revenues or market share. It is calculated by dividing your own brand’s market share (revenues) by the market share (or revenues) of your largest competitor in that industry. For example, if your competitor’s market share in refrigerator’s industry was 25% and your firm’s brand market share was 10% in the same year, your relative market share would be only 0.4. Relative market share is given on x-axis. It’s top left corner is set at 1, midpoint at 0.5 and top right corner at 0 (see the example below for this).
Find out market growth rate. The industry growth rate can be found in industry reports, which are usually available online for free. It can also be calculated by looking at average revenue growth of the leading industry firms.
Market growth rate is measured in percentage terms. The midpoint of the y-axis is usually set at 10% growth rate, but this can vary. Some industries grow for years but at average rate of 1 or 2% per year. Therefore, when doing the analysis you should find out what growth rate is seen as significant (midpoint) to separate cash cows from stars and question marks from dogs.
Draw the circles on a matrix. After calculating all the measures, you should be able to map your brands on the matrix. You should do this by drawing a circle for each brand. The size of the circle should correspond to the proportion of business revenue generated by that brand.
Expected Output?
We clearly identify in which situation each of the products in our portfolio are included.
You can also download full supportive document